
Company AI Analysis
AI Analysis consists of two phases:
- Selecting and filtering companies based on the scatter chart
- Analyzing the selected companies using AI
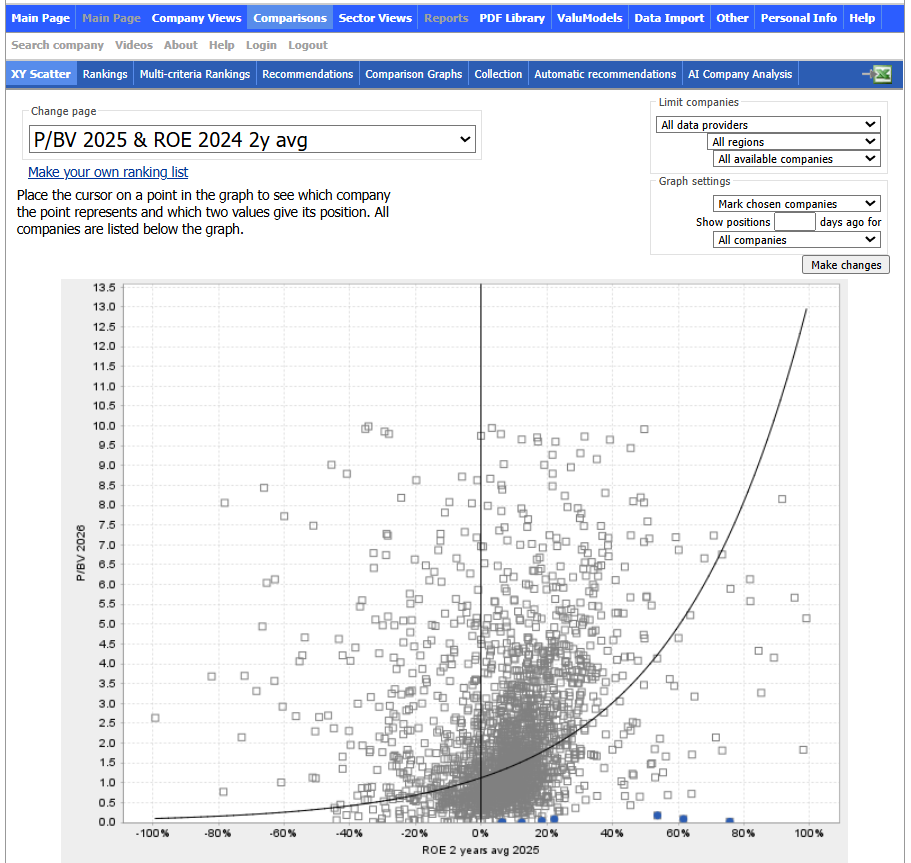
Select your company list from the dropdown and an XY scatter of the companies will open. By hovering the mouse on top of the scatter points, you can see the company name and its key figures.
In selection tools below, we can select and sort companies. Area selection includes companies in the selection and Line sorting tool ranks the selected companies based on “order of merit”.
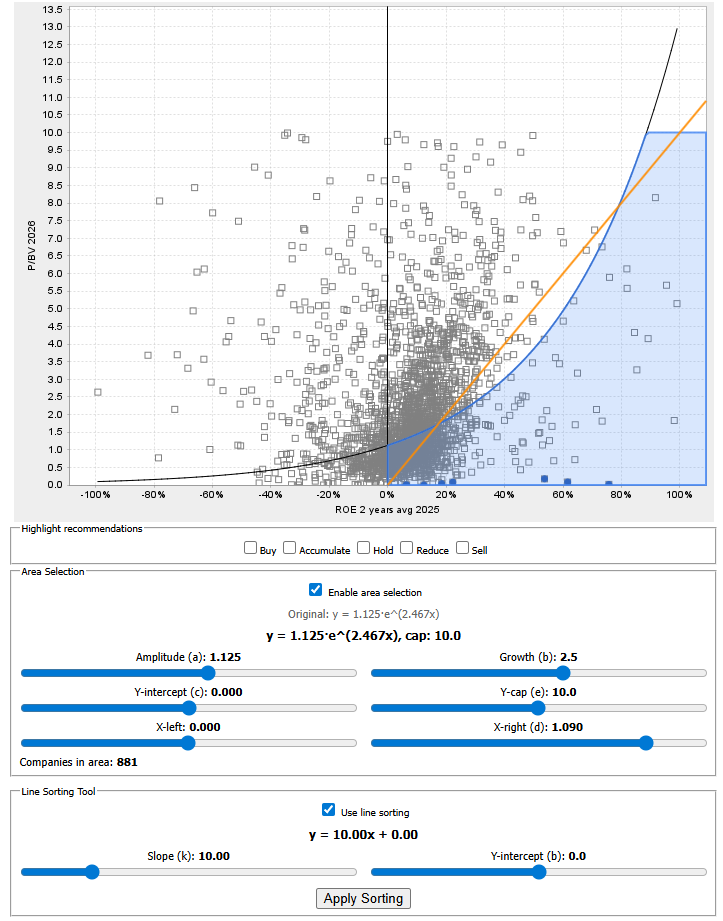
1. Area Selection
With the Area Selection feature, you define the blue area within which companies are included in the AI analysis. Parameters used for the boundary:
- Amplitude (a): Adjusts the curve’s baseline height—i.e., how high the top edge of the box sits across all x-values.
- Growth (b): Controls how quickly the upper boundary of the blue area rises from left to right. A value of 0 produces a horizontal upper edge; higher values make the growth steeper.
- Y-intercept (c): Shifts the curve up or down and sets the starting level at x = 0.
- Y-cap (e): Sets an upper limit that the curve cannot exceed, regardless of the growth rate.
- X-left: Defines the minimum x-value to which the upper boundary of the blue area extends—in practice, this sets the “left edge” of the box.
- X-right (d): Defines the maximum x-value to which the upper boundary of the blue area extends—in practice, this sets the “right edge” of the box.
- X-left: Defines the minimum x-value to which the lower boundary of the blue area extends—in practice, this sets the “left edge” of the box.
2. Line Sorting Tool
Line Sorting affects how companies are ranked in “order of merit.”
The key parameter is Slope, which determines the line’s slope. Y-intercept is only a visual aid and does not affect the final ranking.
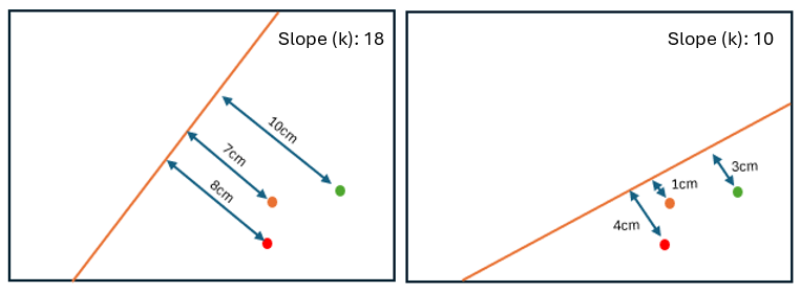
A company’s position in the list is based on its perpendicular distance from this line: the greater the distance, the higher the rank. In other words, the line acts as a reference line, and the “best” company is the one that lies farthest away from it.
Interpreting the slope
Slope can be used to reflect your own risk preference: do you prefer companies with higher ROE even if they carry more risk, or do you prefer safer, more moderate returns?
For example: is it better to buy a company with 80% ROE even though its P/BV is 2-3, or a company with 10-15% ROE when its P/BV is only 0.5?
Mathematically, the answer might seem straightforward; however, only a person can estimate how reliable the forecasts are and whether they are likely to be realized with sufficient certainty. Of course, if the figures do materialize, the stock price is expected to rise. However, it is generally more likely that the company with a smaller ROE estimate will perform as expected, whereas achieving 80% ROE involves higher risk. That said, if you understand the company and its business well, you may be inclined to favor the company with 80% ROE for very good reasons.
Example (image below):
- When the line is steeper (higher slope), a certain company (e.g., the green dot) may be farthest from the line and therefore rank highest.
- When the slope is reduced (the line is made flatter), the direction of the reference line changes, which can cause another company (e.g., the red dot) to become farthest from the line and thus rank highest.
When you’re satisfied with the Area Selection and Line Sorting settings, you can:
- select companies individually from the list, or
- select all companies in the area using the “Select All” function.
After that, start the analysis by clicking “Start AI Analysis.”
3. AI analysis of the selected companies
On the Scatter page, clicking “Start AI Analysis” takes you to the AI Company Analysis page, where you can choose the AI model to use and start the analysis. You can select all the companies inside selected area or select them individually by clicking them on the list below (holding SHIFT will select multiple companies).
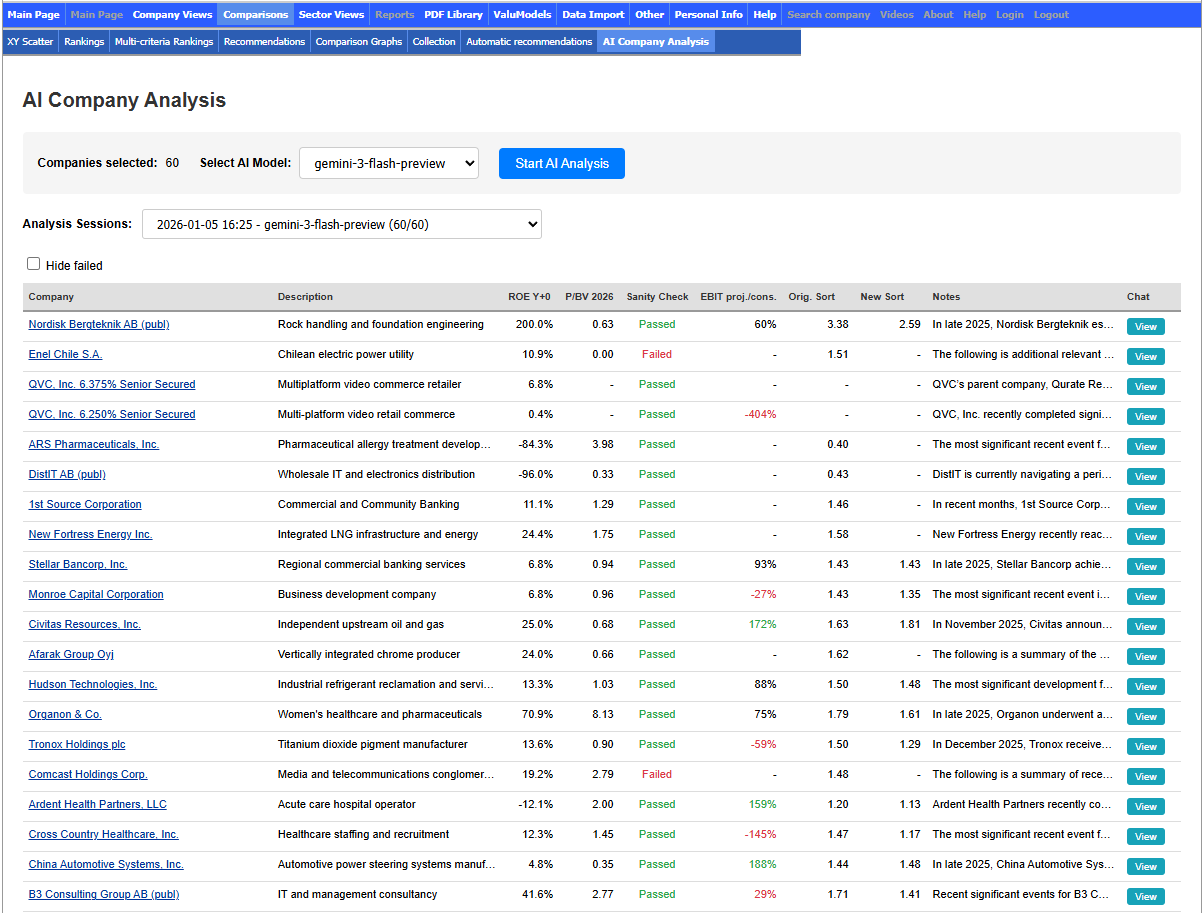
The result is a table containing the following fields:
- Company: The company name and a link to our system’s company details
- Description: A short industry/business description generated by the AI
- ROE Y+0: Forecast ROE for the first forecast year
- P/BV 2026: Forecast P/B for 2026 (market capitalization / forecast equity)
- Sanity Check: The AI’s check of whether our system’s market cap and equity match external sources (“Failed” if the deviation is > 15%)
- EBIT proj./cons.: An estimate of how the current-year EBIT projection compares to the consensus forecast (e.g., actual Q1–Q3 = €150m ⇒ full-year projection = €200m; consensus €160m ⇒ 125%). Does not account for possible seasonality.
- Orig. Sort: The company’s distance from the Line Sorting reference line using the original ROE value (the greater the distance, the higher the rank)
- New Sort: The same distance, but with ROE first scaled by the EBIT proj./cons. factor (e.g., ROE 30% and EBIT proj./cons. 125% ⇒ scaled ROE 37.5%). Interpretation:
- If EBIT proj./cons. > 100%, the distance from the line increases ⇒ New Sort > Orig. Sort
- If EBIT proj./cons. < 100%, the distance decreases ⇒ New Sort < Orig. Sort
- Notes: Notes compiled by the AI (news, dividend policy, management targets)
- Chat: View the AI’s outputs and the prompts sent to it (Sanity Check, Description, Notes)