Related instructions on other pages
- “How the Balance sheet is made even?” in section Balance sheet
- “DCF-Valuation” and “EVA-Valuation” in section Wacc & Valuation
Estimating dividends
You have three possible ways to forecast total dividends:
1. Payout ratio %
2. Dividend per share
3. Enter Total dividends directly
How to define which parameter dominates?
From the first two you are able to choose which parameter you would like to use as dominating. Dominating parameter is a parameter that always remains unchanged unless you change the parameter itself. For example if Net earnings changes, it should change either Payout ratio % or Dividend per share. This can be decided with the following way:
In the Estimate parameters (and also in Capitalization) section, there is row called Is payout ratio % dominating?. The row can be found under Payout ratio %.
1 in this row means ‘yes’ and 0 means ‘no’. So if you would like to use Dividend per share for the current year and Payout ratio % for the rest of the future years, the row in your model should look like this.
![]()
(If you start to fill an empty model, Dividend per share is dominating for the first two years and Payout ratio % after that as a default.)
Calculation rules
When you use Payout ratio % (dominating = 1), the model calculates:
1. Total dividends = Payout ratio % x Net earnings
2. Dividend per share = Total dividends / No of shares total at year end*
* A sum of series I and II
When you use Dividend per share figures (dominating = 0), the model calculates:
1. Total dividends = No of shares (series I) at the year end x Dividend per share (series I) + No of shares (series II) at the year end x Dividend per share (series II)
2. Payout ratio % = Total dividends / Net earnings
Here is an example how Total dividends can be calculated:
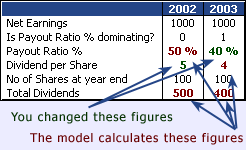
If you change a parameter in Income statement so that Net earnings become, let us say 2000, the result is different for the two years:
In 2002 (when Dividend per share is dominating) Total dividends remain in 500 and Payout ratio % becomes 25 %.
However, in 2003 (when Payout ratio % is dominating) Total dividends becomes 800 and Dividend per share adjusts itself to 8.
Nevertheless, no matter which parameter is dominating, you can still input Payout ratio % or Dividend per share. The model calculates another afresh but does not change the domination.
If you change Total dividends directly, the model calculates:
1. Payout ratio % = Total dividends / Net earnings
2. Dividend per share = Total dividends / No of shares total at year end*
* A sum of series I and II
History years
(Notice that in history years, Total dividends are always calculated on the basis of Dividend per share figures which are inputted. Payout ratio % is calculated as Total dividends / Net earnings.)
Estimating Working capital
Formula
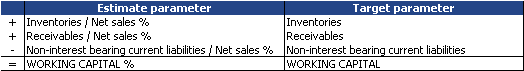
Working capital % is an aggregate of three items, which of every one is used to estimate one Balance sheet parameter:
How to choose percentage values?
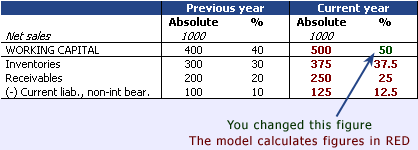
It is reasonable to assume that company remains the same level of working capital related to net sales as in history. For example usually when net sales grows, inventories grow too. And since receivables consist mainly of sales receivables, most probably also receivables increase.
So when you consider values for these three parameters, start with the last history year values or some average value from the latest history years.
Fine tuning
Since it is important for companies that working capital would tie as little capital as possible, they have a tendency to lower for example inventories level. You may see this in historical Inventories %, as the value may have come down year-by-year, and thus assume that this trend would continue also in the future.
Estimating fixed assets and gross investments
How Fixed assets, total is calculated?
In the company model there are two types of fixed assets: Fixed assets, total and so called Fixed assets, ordinary. Both can be found in Balance sheet assets:
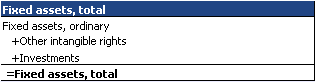
Other intangible rights and Investments can be entered directly. Fixed assets, ordinary is however a bit more complicated. See the following chapters.
How ordinary fixed assets are calculated?
Fixed assets, ordinary is calculated as follows:
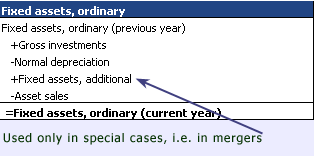
Fixed assets, additional and Asset sales are direct input figures. You can find them in Other estimating parameters section (Client). Normal depreciation is explained in Income statement document. Again Gross investments are a bit more complicated. They, and thus also Fixed assets, ordinary, can be estimated in three different ways.
How to estimate investments and fixed assets?
You have three possible ways to forecast Gross investments:
1. Gross investments (absolute) (can be dominating)
2. Gross investments % (of Net sales) (always dominated)
3. Fixed assets % (of Net sales) (can be dominating)
You are able to choose which parameter you would like to use as dominating. Dominating parameter remains always unchanged unless you change the parameter itself. For example if Net sales are changed, the two first of the three parameters above should change, not the third one. In Valuatum company model Gross investments % cannot be dominating but the other two can. Whether Gross investments or Fixed assets % are dominating, can be decided as follows:
In the Estimate parameters’ Investments section, there is a row called Is Fixed assets % dominating?. 1 in this row means ‘yes’ and 0 means ‘no’. When you use 0, Gross invesments become dominating.
So if you would like to use Gross invesments for the current year and Fixed assets % for the rest of the future years, the row in your model should look like this.
![]()
(Note that If you start to fill an empty model, Gross invesments are dominating for the first two years and Fixed assets % is a default after that.)
You have three possible ways to forecast Gross investments and Fixed assets, depending on which parameter is dominating
When you use Fixed assets % (dominating = 1), the model calculates:
1. Fixed assets, ordinary = Fixed assets % x Net sales
2. Gross investments = Fixed assets, ordinary – Fixed assets, ordinary (prev. year) + Normal depreciation – Fixed assets, additional + Asset sales
3. Gross investments % = Gross investments / Net sales
When you use Gross investments figures (dominating = 0), the model calculates:
1. Fixed assets, ordinary = Fixed assets, ordinary (prev. year) + Gross investments – Normal depreciation + Fixed assets, additional – Asset sales
2. Fixed assets % = Fixed assets, ordinary / Net sales
3. Gross investments % = Gross investments / Net sales
Nevertheless, as said before, you can also estimate Gross investments %. Then other two parameters are calculated afresh:
1. Gross investments = Gross investments % x Net sales
2. Fixed assets, ordinary = Fixed assets, ordinary (prev. year) + Gross investments – Normal depreciation + Fixed assets, additional – Asset sales
3. Fixed assets % = Fixed assets, ordinary / Net sales
Here is an example how the parameters can be used:
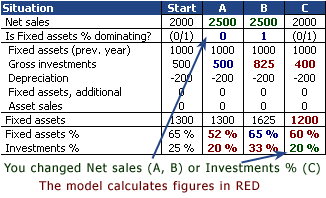
In the situations A and B Net sales has grown. Since Is Fixed assets % dominating is different in the situations, the results are also different. Gross investments are used as a dominating parameter in situation A. So Fixed assets % is calculated afresh. The opposite occurs In situation B.
In situation C Gross investments % have been inputted. Then both Fixed assets % and Gross investments are calculated afresh.
Nevertheless, no matter which parameter is dominating, you can still input any of the three parameters. The model calculates others afresh but does not change the domination.
Investments and fixed assets in history years
In history years, Gross investments are always inputted and other parameters are calculated on the basis of them.
Estimating Balance sheet parameters
This page tells you how you can forecast i.e. change parameters in Balance sheet for estimate years. If you would like to get familiar with Balance sheet in past years, have a look at History document.
Notice that every parameter in the model includes a tooltip which may tell you the same thing as this document. You can see the tooltips when you set the mouse over the headings.
Keeping Balance sheet even
For the estimate years, the model always makes Balance Sheet even. This is done either
1. By increasing or decreasing interest bearing debt or
2. By increasing interest-bearing financial assets (cash at bank).
The model evens out the balance sheet after you have first forecasted all the items on both assets and liabilities. Notice that:
1. When the model evens out the balance sheet, it never changes your estimates. It can only increase interest-bearing debt, decrease it to the minimum level defined by you or increase generated interest bearing financial assets.
2. The model does not do any levelling in case you have forecasted the assets’ and liabilities’ sides to be equal.
3. You can change your balance sheet estimates at any time. The model does the levelling always after your estimate changes – if necessary.
4. The history years are not part of levelling. So, in case you have mistakenly filled in an uneven Balance sheet in some history year, the error will not be corrected by the model.
Next two chapters tell you how you can forecast i.e. change parameters in Balance sheet for current and future years. If you would like to get familiar with Income statement in past years, see history document.
To have a closer look how the balance sheet is made even, see instructions “How the Balance sheet is made even?” in section Balance sheet.
Balance Sheet Parameters – Assets
| Goodwill | 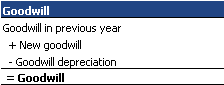
New goodwill and Goodwill depreciation are entered into the model in absolute terms. |
| Fixed assets total | Consists of the following three items: 1. Other intangible rights To be changed directly (see self-filling input figure) 2. Fixed assets ordinaryCan be forecasted with three different methods. 1. Fixed Assets / Net sales %. 2. Gross investments in absolute terms. 3. Gross investments % (relative to Net sales)Whatever way you use, the other parameters adjust themselves accordingly. Have a closer look to fixed assets and investments. Note that Fixed assets ordinary is intended to consist of normal, i.e. tangible and depreciable fixed assets only. 3. Investments Notice that this Balance sheet Investments does not have anything to do with Gross investments that refer to the increase in depreciable assets over one year. Investments in Balance sheet are a non-depreciable item that consists of different securities the company has acquired, for example in associated companies. These securities have all in common that they must support the business and not to be only financial investments. If they would be pure financial investments then they would be booked either in financial assets or in inventories. |
| Inventories | Can be forecasted with: 1. Inventories / Net sales % 2. Changing the parameter Net working capital %. The change affects Inventories %, Non-interest and Interest bearing financial assets % and also Current non-interest bearing liabilities %. |
| Total financial assets | Consists of the following items: 1. Non-interest bearing financial assets Can be forecasted with: 1. Non-interest bearing financial assets/ Net sales % 2. Changing the parameter Net working capital %. The change affects Inventories %, Non-interest and Interest bearing financial assets % and also Current non-interest bearing liabilities % 2. Interest bearing financial assetsCan be forecasted with: 1. Interest bearing financial assets/ Net sales % 2. Changing the parameter Net working capital %. The change affects Inventories %, Non-interest and Interest bearing financial assets % and also Current non-interest bearing liabilities %Interest bearing financial assets, generated A parameter that is changed only by the model as it evens out the different sides of the balance sheet. You cannot change this parameter directly but when you are determining the size of the assets and liabilities with other parameters, you are also determining this item indirectly. |
Balance Sheet Parameters – Liabilities
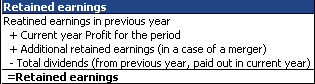
| Share capital | To be changed directly (see self-filling input figure) Such items as `Revaluation fund´ and `Share price in excess of nominal value´ can be included in Share capital. |
| Retained earnings | Calculated by the model with the following formula:
|
| Minorities | To be changed directly (see self-filling input figure) |
| Reserves | To be changed directly (see self-filling input figure) |
| Deferred tax liability | To be changed directly (see self-filling input figure) |
| Convertibles | To be changed directly (see self-filling input figure) |
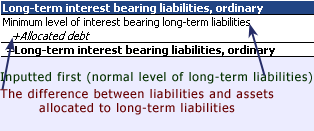
| Interest bearing long-term liabilities, ordinary | The item consists of Minimum level of interest bearing long-term liabilities (desired level of long-term liabilities) and Allocated debt, which evens out the difference if Balance sheet assets become bigger than liabilities. Have a closer look how the Balance Sheet is made even.
All the estimates can be made in section `Estimate parameters – All estimate parameters´ of the Company model. |
| Non-interest bearing long-term liabilities | To be changed directly (see self-filling input figure) |
| Non-interest bearing current liabilities, ordinary | Can be forecasted with: 1. Non-interest bearing current liabilities, ordinary / Net sales %. 2. Changing the parameter Net working capital %. The change affects Inventories %, Non-interest and Interest bearing financial assets % and also Current non-interest bearing liabilities % |
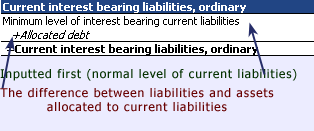
| Interest bearing current liabilities | The item consists of Minimum level of interest bearing current liabilities (desired level of current liabilities) and Allocated debt (which evens out the difference if Balance sheet assets become bigger than liabilities). Have a closer look how the Balance Sheet is made even.
The level of Allocated debt is determined with the estimate parameter Share of generated debt allocated to long-term liabilities. All the estimates can be made in section `Estimate parameters – All estimate parameters´ of the Company model. |
Estimating Net sales
Four levels of Net sales
In Valuatum Company Model you have four different levels to estimate Net sales:
1. Total
2. Quarter (two first years)
3. Division
4. Quarter and division (two first years).
Besides different levels, you can estimate Net sales growth % or just absolute Net sales. Whichever way and whatever level you use, the other figures react to your changes.
What happens when I change total Net sales?
Since there is a possibility to estimate Net sales for so many ways, there must be rules how to keep the other levels in balance. In the company model there are two basic rules for the changes:
1. Allocating on the basis of the old proportions.
2. Calculating a sum.
The first rule is used when you enter e.g. total Net sales and the model has to decide how the lower levels are calculated.
The second rule is used in the opposite cases. If you estimate e.g. second division’s Q3’s Net sales, new second division’s Net sales is a sum of all quarters and new Q3’s Net sales is a sum of all Q3-figures.
Net sales growth % as a dominating variable
When you estimate current year’s Net sales, there are two possibilities for the following years: either growth % or absolute figure to change. In the company model Net sales growth % is the dominating parameter (and absolute Net sales the one that changes).
Estimating EBIT
Four levels of EBIT
In Valuatum Company Model you have four different levels to estimate EBIT:
1. Total
2. Quarter (two first years)
3. Division
4. Quarter and division (two first years).
Besides different levels, you can estimate EBIT % or just absolute EBIT. Whichever way and whatever level you use, the others react to your changes.
What happens when I change total EBIT?
Since there is a possibility to estimate EBIT for so many ways, there must be rules how to keep the other levels in balance. In a company model there are two basic rules for the changes:
1. Allocating on the basis of the old proportions.
2. Calculating a sum.
The first rule is used when you enter e.g. total EBIT and the model has to decide how the lower levels are calculated.
The second one is used in the opposite cases. If you estimate e.g. second division’s Q3’s EBIT, new second division’s EBIT is a sum of all quarters and new Q3’s EBIT is a sum of all Q3-figures.
EBIT % as a dominating variable
When you estimate current year’s Net sales, there are two possibilities: either EBIT % or absolute EBIT changes. In the company model EBIT % is the dominating parameter (and absolute EBIT the one that changes).
Estimating Income statement parameters
This chapter tells you how you can forecast i.e. change parameters in Income statement for estimate years. Notice that every parameter in the model includes a tooltip, which may tell you the same thing as this document.
Income Statement Parameters
| Net sales | Can be forecasted with: 1. Net sales growth % (dominating) 2. Direct input figure Have a closer look at Net sales (e.g. how to use division and quarter levels). |
| Costs | The difference between Net sales and EBITDA (you cannot change costs directly). |
| EBITDA | EBIT plus Depreciation (you cannot change EBITDA directly) |
| Total depreciation | 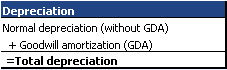 Notice that you can also input Total depreciation directly. Then the change is allocated to Normal depreciation. |
| Normal depreciation | Can be forecasted with: 1. Depreciation / Fixed assets % 2. Direct input figure |
| Goodwill amortization | Direct input figure. |
| EBIT | Can be forecasted with: 1. EBIT % (dominating) 2. Direct input figure Have a closer look to EBIT (e.g. how to use division and quarter levels) |
| Net financial items | 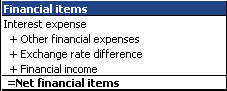 Notice that you can also input Net financial items directly. Then the change is allocated either to Interest expenses (negative change) or to Financial items (positive change). |
| Interest expenses | Can be forecasted with: 1. % of Long-term and current interest bearing liabilities 2. Direct input figure |
| Other financial expenses | Direct input figure. |
| Exchange rate differences | Direct input figure. |
| Financial income | Can be forecasted with: 1. % of Interest bearing financial assets (average yearly assets) 2. Direct input figure |
| Associated companies’ profit/loss | Direct input figure. |
| Pre-tax profit | Output figure that is calculated by the model only. |
| Taxes on continuing operations | Can be forecasted with: 1. Tax rate % 2. Direct input figure |
| Minorities | Direct input figure. |
| Net earnings | Output figure that is calculated by the model only. |
| Extraordinaries (after tax) | 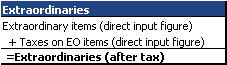 |
| Other | Direct input figure. |
| Profit for the period | Output figure that is calculated by the model only. |