Dynamic Comparisons
The Valuatum system has tools to compare different things, such as companies, values of different variables and industries. These tools are split into two groups: Comparisons and Dynamic Comparisons. See more on Comparisons here.
Contents
Dynamic rankings
Using our Dynamic Rankings, you can screen companies using multiple criteria. You may select any of the available variables from any year and define both minimum and maximum values for them. You can also sort the list according to each variable and limit the companies by industries. The detailed steps are explained below.
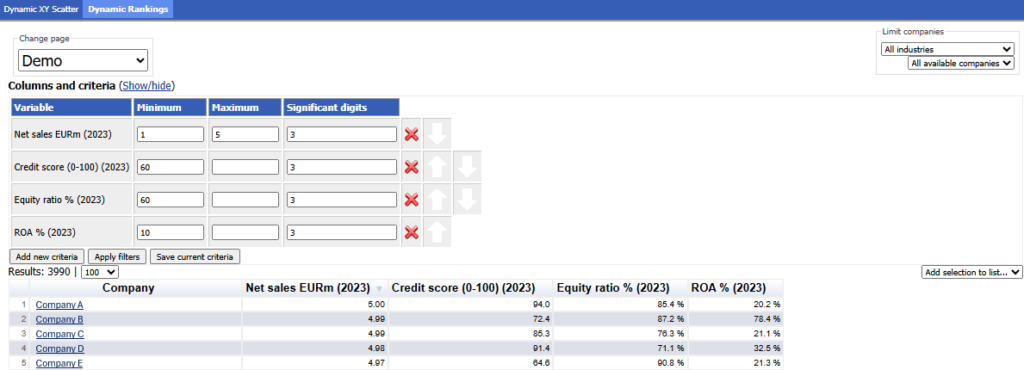
Overview of the page
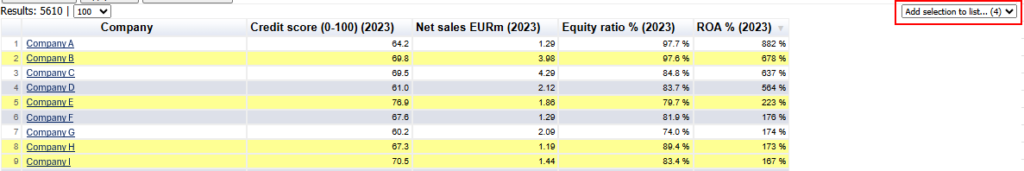
Below is an image of the page with a ready-made list ‘Demo’ that filters companies by their Net sales, Credit score, Equity ratio and ROA %. Note: Percentage values should be entered as whole numbers. For example, if you want to filter for companies with an operating profit margin greater than 5%, enter 5 (or 5%) in the “minimum” field (not 0.05).
Making your own comparison
If you want to make your own comparison, see the image and instructions below it. Note that you don’t have to set a minimum or maximum set for each variable. If you do not use any limits, it will output all values of that variable for the companies meeting the other requirements.
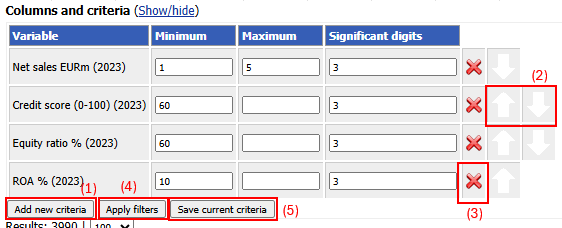
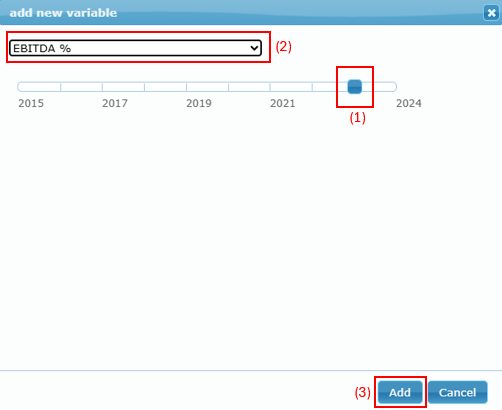
(1) First, press ‘Add new criteria’ and a pop-up window will appear (see image below). Select the year (1) and the variable (2) you want the value from and press ‘Add’ (3).
(2) You can change the order of the listed values using the arrows. The list is automatically sorted by the top variable (e.g., ‘Net Sales’ in the example).
(3) You can also remove unnecessary variables by pressing ‘X’.
(4) Once you’ve set all the variables you want, press ‘Apply filters’ to generate a new list (similar to the one shown in the first image with ‘Company A’, ‘Company B’, etc.)
(5) You can also save your own comparisons for later use by pressing ‘Save current criteria’. In the pop up that follows, we recommend setting ✔ to ‘Increment criteria years annually’. This allows the variables to always be from the same relative year, i.e., if you want the data to always reflect the most current year (e.g. 2024 when creating the list), the year will automatically update to 2025 once enough data becomes available.
Other functionalities
Sorting lists
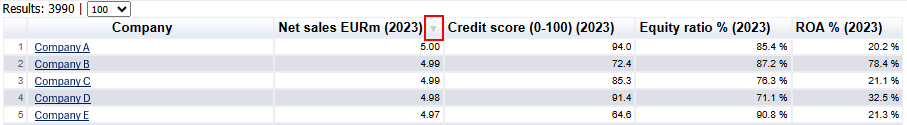
You can see how the list is sorted by the small arrow next to a column header (either up or down). You can change the sorting by clicking on ‘ROA % (2023)’ column for example. Clicking once sorts from highest to lowest; clicking again reverses the order.
Saving company lists
You can also save selected companies to a list for later use. Hold down the ‘Ctrl’ key and click on the rows to select multiple companies. Once selected, click on ‘Add selection to list’. You can either create a new list (public or private) or add the companies to an existing list.
Filtering based on industry or saved company lists
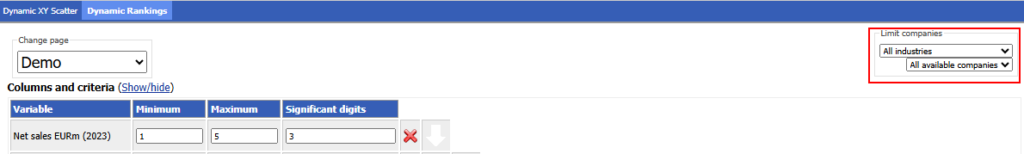
In addition to filtering company data by variables, you can also filter results to show only companies from specific industries or from your saved company lists. These options are located in the top-right corner of the page under ‘Limit companies’.
Select an industry from the ‘All industries’ dropdown, or choose a saved company list from the ‘All available companies’ menu. After selecting the industry or company list, press ‘Apply filters’ again to update the results.
Note: As of April 2025, the industry filter supports only one industry at a time. There is currently no option to select multiple industries simultaneously.
Dynamic XY scatter
This page is essentially the same as the Dynamic Rankings, but it also contains a scatter graph in addition to the list of companies. On this page, you can plot companies onto a scatter graph according to variables and value ranges of your choosing. Choosing the variables is self-explanatory: you add variables from the ‘Add new criteria’ button and you set the minimum and maximum values for each variable. By clicking the ‘Apply filters’ button the scatter graph is drawn and a list of companies that match the criteria is shown underneath the graph. For a scatter graph to be drawn, you need to add two criteria. You can add more if you like, and the additional variable values will be shown in the list but naturally not in the scatter graph. If you want to use the criteria later, you can save them by clicking the ‘Save current criteria’ button. Then you can easily access these criteria from the drop-down list on the top left corner of the page.
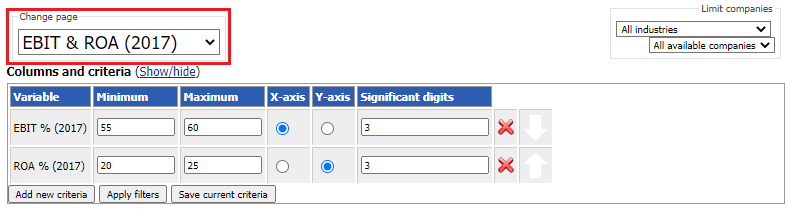
If want to filter companies by industry, you can do that from the drop-down menu on the top right corner of the page.
You can view the values of the selected variables of a company by hovering over the dot of the wanted company on the graph. You can go to the company’s page by clicking the dot or by clicking the company’s name in the list.
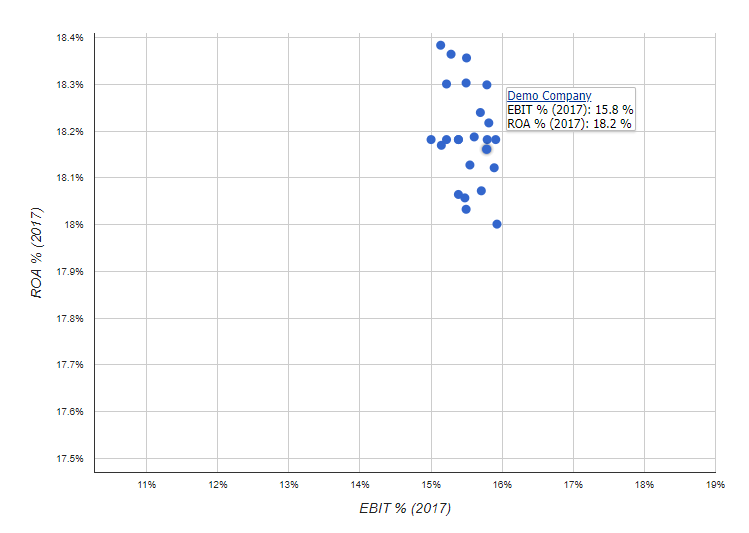
You can also change move around in the graph. You can zoom in and out of the graph by hovering your mouse over the graph and scrolling (down for zooming in and up for zooming out). You can also drag the graph around to view different parts of it.
By default, the companies are listed in descending order according to the first criteria. This can be changed by clicking the variable names in the list header: clicking a variable will sort the list in descending order according to that variable and clicking the variable again will sort the list in ascending order.