Comparisons
Comparisons tool offers an efficient way to do peer group analysis. User can compare the key figures of any group of companies in the system with tools such as scatters and rankings-lists. Comparisons can be made within industry, or inside a group of companies selected by the user.
Key features of Comparisons Pages
Comparisons using rankings-lists
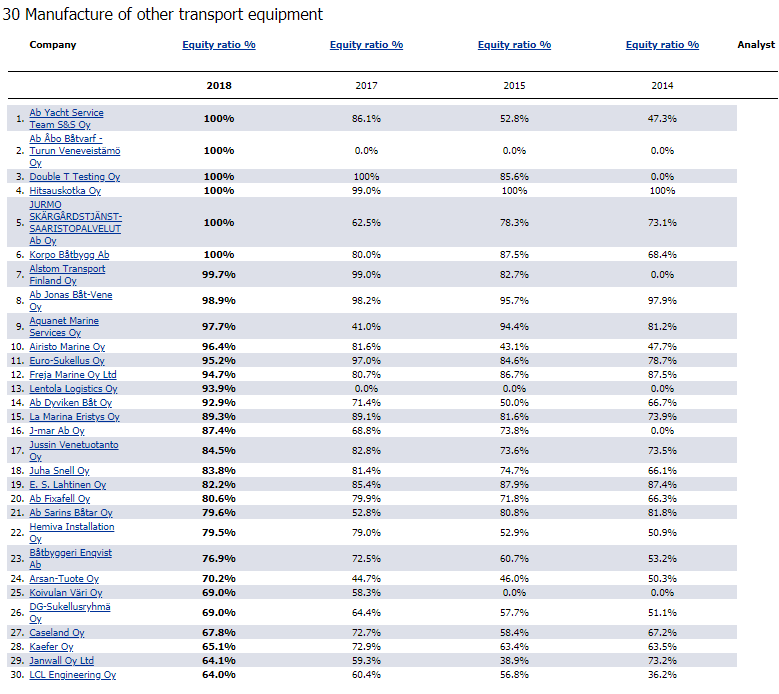
- Companies can be ranked within an industry or a group of companies using any key figure or ratio
- In addition to ready-made rankings list, the user can create her own lists including any key figures that exist in the system
- Both historical figures and estimates generated by the system or updated by an analyst can be used in comparisons
- Layout and content of the pages can be modified – choose the figures and graphs you want to use
- Hundreds of ready-made figures exist in the system – and new ones can be created in a few minutes when requested
Comparisons using XY-Scatters
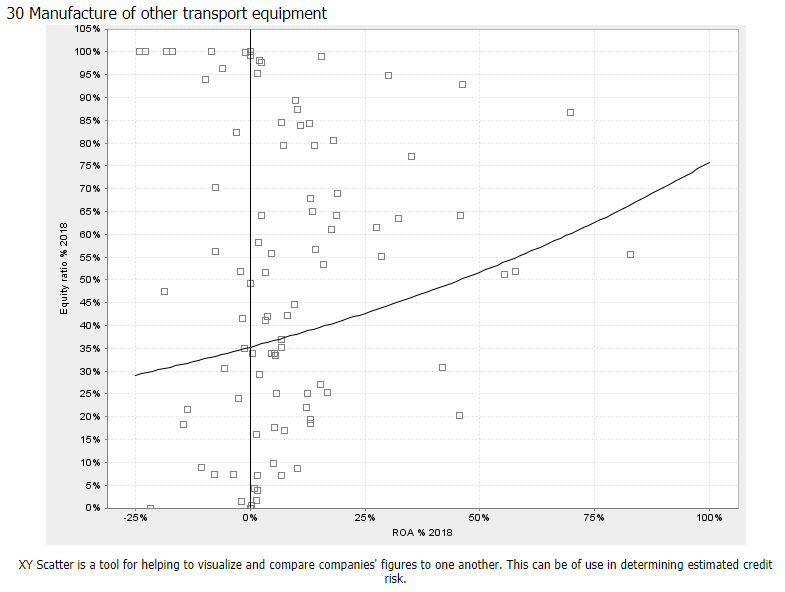
- Companies can be compared in xy-scatter using any key figure
- The comparison can be done within an industry or inside a peer group defined by the user
- Every point in the scatter is linked to the company views page of the company in question
Own company lists

- It is easy to select a list of companies and compare them to another group of companies (e.g. to a chosen industry) in xy-scatter
- Scatter is an illustrative tool to compare financial conditions of companies to a peer group in graphical form